| Create a Sample Database:
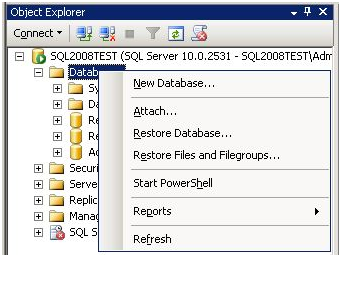
Create a new database in SQL Server so that it can be used for pulling the data from SQL to report in SSRS.
Create a Simple Report with the Wizard:
BIDS provides a Report Designer which allows you to define every aspect of your report. In addition BIDS provides a Report Wizard which will guide you through the steps to build a simple report. When you are getting started with Reporting Services, the Report Wizard should be your first choice. Once you've built a report with the wizard, you can continue customizing it with the Report Designer.
Steps to build a simple report using Report Wizard:
- Launch the report wizard
- Create a shared data source
- Design a query
- Select a report type
- Design a table
- Choose the table layout
- Complete the wizard
Launch the report wizard:
The BIDS Solution Explorer shows our Report Server project along with Shared Data Sources and Reports nodes as shown below.
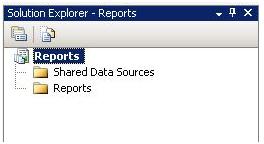
Right click on the Reports node and select Add New Report to launch the Report Wizard as shown below.
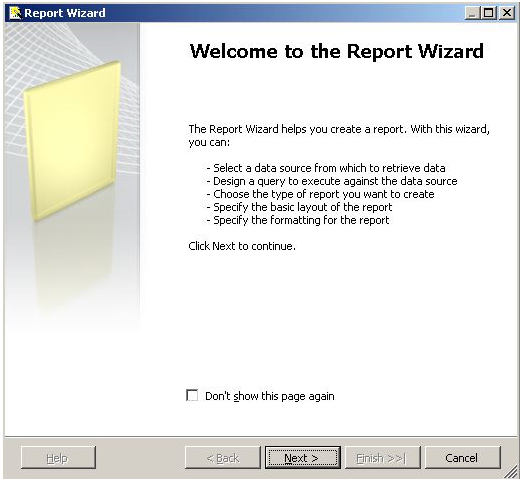
Note the checkbox "Don't show this page again". You want to click it as there isn't much need to see this dialog every time you want to design a new report using the wizard. Click the Next button to create a data source for your report .
Create a Shared Data Source :
The Data Source contains the information necessary to retrieve the data that we want to render on our report. Reporting Services can access data in relational databases, OLAP databases, and just about other any data source for which you have an ODBC or OLE DB driver.
When we create a Data Source we can specify it as shared which means it can be used by any report in the same project. If a Data Source isn't shared it just means that its definition is stored inside the report and it cannot be shared with another report.
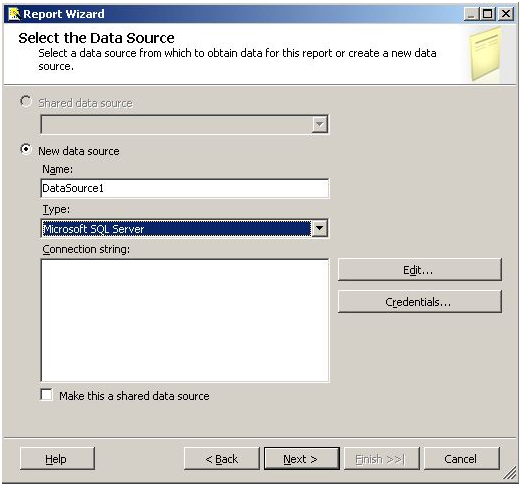
After launching the Report Wizard you will be presented with the Select the Data Source dialog as shown below.
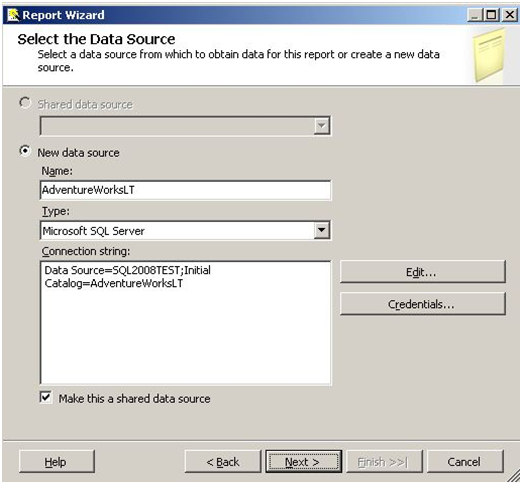
Our project does not have any Shared Data Sources yet so we do not have the option of selecting an existing Shared Data Source for our new report. Instead we will have to define a Data Source.
- Name - Choose a descriptive name for this Data Source. Do not put any spaces in the name, if you do so you will get an error message when you complete the wizard and your Data Source will not be created
- Type - Select from the available options in the dropdown list, the default value of Microsoft SQL Server is the correct one for the database that we are using
- Connection String - Enter the connection string for your Data Source. Usually you want to click the Edit button to enter the details and have the connection string created
- Edit button - Rather than entering the connection string, click this button to display the Connection Properties dialog where you can enter some information and have the connection string created for you
- Credentials button - Click this button to display the specify Data Source Credentials dialog where you can specify the credentials to use when connecting to your Data Source
- Make this a shared data source checkbox - Click this checkbox to create a Shared Data Source. Any report in the same project can use this Data Source.
Click the Edit button to display the Connection Properties dialog. Fill the Server name and select the database as shown below.
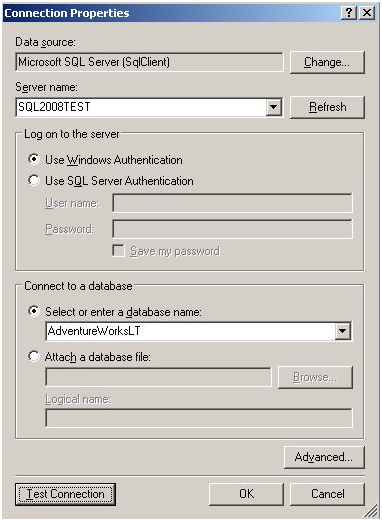
The Server name is the one where your SQL Server database is deployed. If you are running a named instance of SQL Server, you will need to specify the Server name as ServerName\InstanceName. If you are running SQL Server locally you can specify local host in place of ServerName. You should click the Test Connection button to verify that you are able to connect to the database then click OK to close the dialog.
Click the Credentials button to display the Data Source Credentials dialog as shown below:
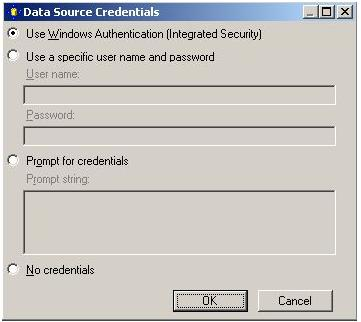
The default selection is Use Windows Authentication (Integrated Security) where the Reporting Services will connect to the Data Source using the Windows credentials of the person running the report. If you want the user to enter the credentials whenever they try to open a report , then select Prompt for credentials. If you want to display the report without providing credential, then select Use a specific username and password.
After completing the above steps, the Select the Data Source dialog will appear as below:
Design the Query
Overview
The Design Query step of the Report Wizard allows us to specify what data we want to retrieve from our Data Source and render in our report.
Explanation
The Design the Query step in the Report Wizard will display the dialog as shown below:
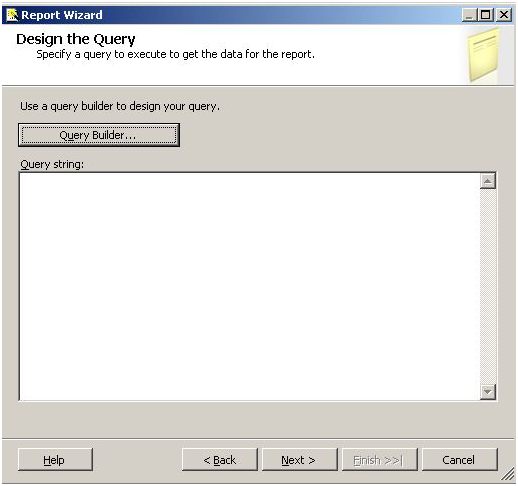
You can click the Query Builder button to graphically build your query or you can type your query directly into the Query string textbox. The following is an example of a query :
|
SELECT
c.ParentProductCategoryName
, c.ProductCategoryName
, SUM(d.LineTotal) Sales
FROM SalesLT.Product p
JOIN SalesLT.vGetAllCategories c
ON c.ProductCategoryID = p.ProductCategoryID
JOIN SalesLT.SalesOrderDetail d
ON d.ProductID = p.ProductID
GROUP BY
c.ParentProductCategoryName
, c.ProductCategoryName
ORDER BY
c.ParentProductCategoryName
, c.ProductCategoryName |
|
The above query will provide us with a sales summary broken down by product category. Copy and paste the query into the Query string textbox in the Design the Query dialog. Alternatively you could click the Query Builder button and graphically design the same or a similar query. The Query Builder dialog displays the Query designer that you are accustomed to seeing in products like Microsoft Access.
Overview
The Select Report Type step of the Report Wizard allows us to choose a Tabular or Matrix type of report.
Explanation
The Select Report Type step in the Report Wizard will display the dialog as shown below:
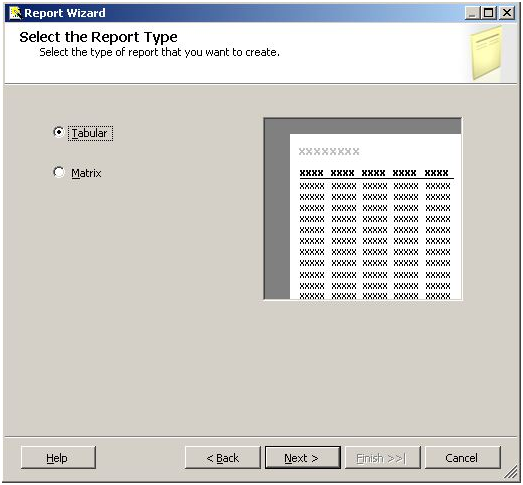
The tabular report type is the traditional report with page headings, column headings, subtotals and totals running down the page. The matrix report type is one where we define the fields that go on the columns and rows. In addition the matrix report type provides interactive drilldown capabilities.
Overview
The Design Table step of the Report Wizard allows us to layout the available fields on our report choosing between Page, Group, and Details.
Explanation
The Design Table step in the Report Wizard will display the dialog as shown below:
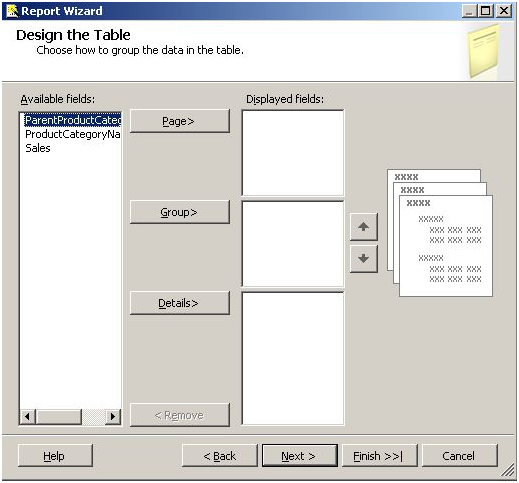
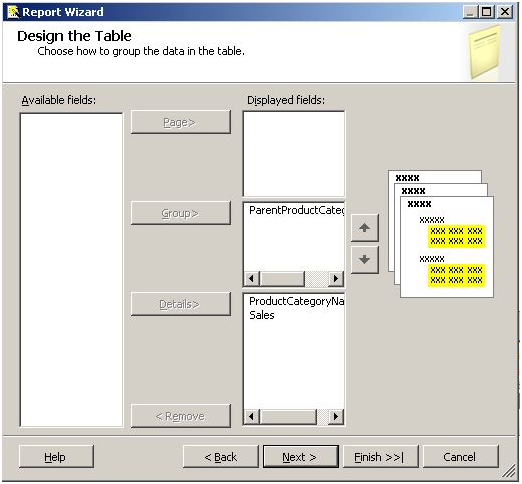
The Available fields list is populated based on the query that you defined in the previous step in the Report Wizard. Click on a field then click on the appropriate button where you want to put that field. Fill the dialog box as shown below:
The following is a description of the buttons in the above dialog:
- Page - put a field in this list when you want to begin a new page when the value of the field changes.
- Group - group by the fields in this list
- Details - the fields in this list appear in each row of the report
Overview
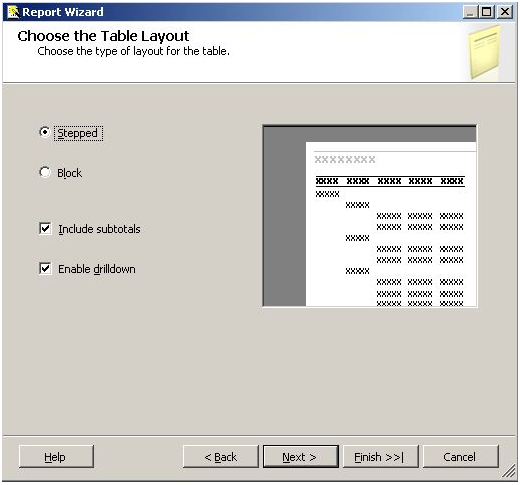
The Choose Table Layout step of the Report Wizard allows us to choose a stepped or blocked layout and whether to include subtotals and enable drilldown.
Explanation
The Choose Table Layout step in the Report Wizard will display the dialog as shown below:
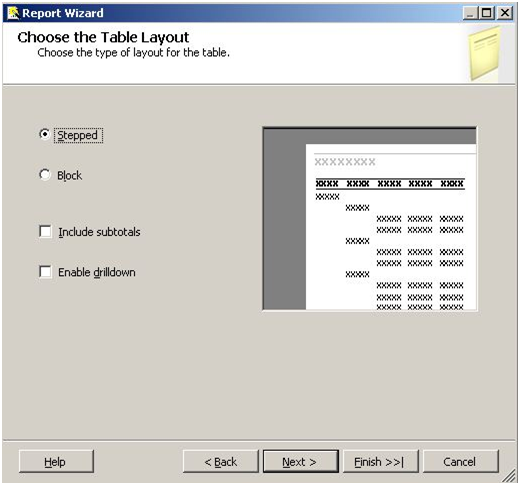
The default of Stepped displays the groupings as shown above. Block moves things in a little closer which saves space, but it disables drilldown. Include Subtotals will provide intermediate totals based on groupings. Enable drilldown will initially hide details and allow expanding with a click on the plus icon.
· Fill in the dialog box as shown below:
Choose the Table Style
Overview
The Choose Table Style step of the Report Wizard allows us to choose from a number of different styles. Each selection provides a different color scheme.
Explanation
The Choose Table Style step in the Report Wizard will display the dialog as shown below:
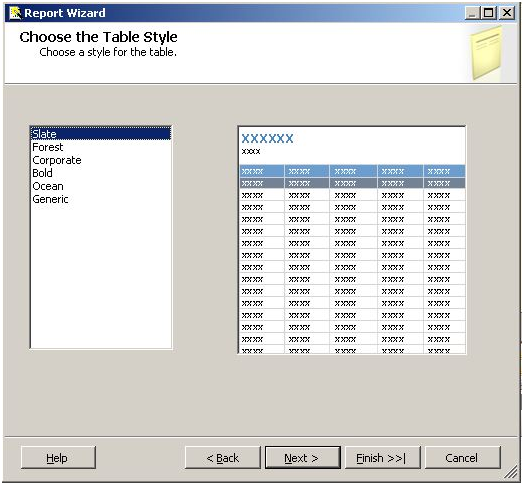
Choose a style from the list of available options the click the Next button to move on to the Completing the Wizard dialog.
Overview
The Completing the Wizard step of the Report Wizard displays a summary of our choices from the previous dialogs.
Explanation
The Completing the Wizard step in the Report Wizard will display the dialog as shown below:
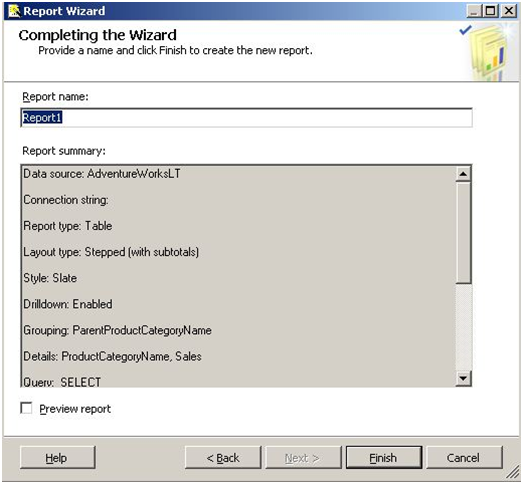
You should provide a descriptive name for your report in the Report Name textbox. You can click the Preview report check box if you would like to see what your report will look like. Scroll through the Report summary to review your choices. If there is something you want to change, click the Back button to revisit the completed dialogs.
Click the Finish button to have the wizard to generate your report. You will now see your report in the Solution Explorer as shown below:
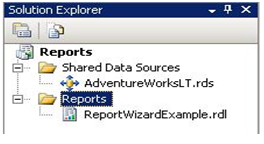
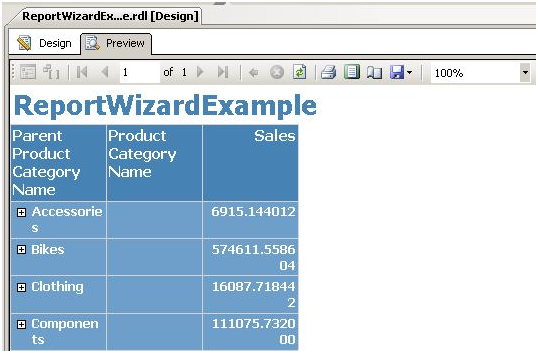
The report will also be displayed in the Report Designer. Click on the Preview tab to render your report. A portion of the report is shown below:
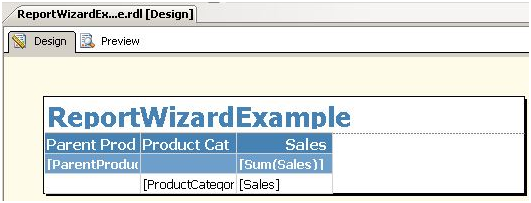
To make some changes to the report, click on the Design tab:
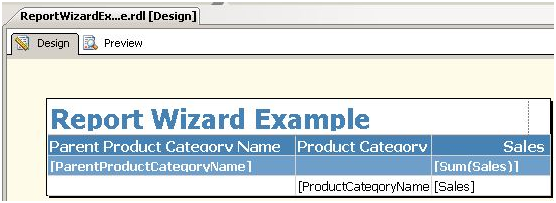
To place spaces between the words in the heading, make the columns a little wider, and change the format of the sales numbers. Here are the steps:
- Click in the report heading between the t and W; add a space; do the same for d and E
- Click in the ParentProductCategory cell, an Excel-like grid will appear, click between the cells at the top of the grid and drag to widen them; you will see the cursor change to <--> when you hover between the cells
- Click inside the [Sum(Sales)] column, locate Format in the Properties window and type C0, this will format the cell as currency with no decimals. If you don't see the Properties window, click the top-level View menu then select Properties Window & click F4. Repeat for the [Sales] column.
After making these changes the report design should look like this:
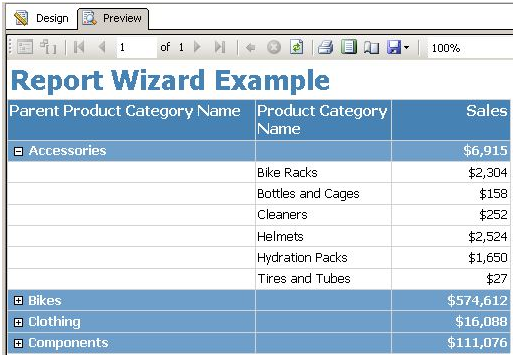
Click on the Preview tab to display the report:
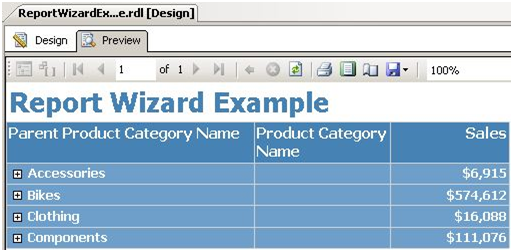
You can click on the + icon to the left of the Parent Product Category Names to drilldown to Product Category Name details as shown below:
|